


I hope you enjoy reading this blog post.
If you want to get more traffic, Contact Us


Click Here - Free 30-Minute Strategy Session
Be quick! FREE spots are almost gone for this Month. Free Quote
A recent Forrester report stated that “Mobile is the face of digital world”. The fact is that mobile devices are the main channel of communication in the world today. This claim is not only just because of the extensive use of mobile devices, neither is it based solely on its projected growth and effectiveness. Mobile devices and apps have changed the outlook of many industries – one of these sectors is the marketing industry.
These days, savvy marketers use mobile marketing analytics to drive core business decisions, because nothing has changed the mobile digital marketing world more than smart devices. Let’s take a look at how mobile devices are changing the world of business today.

Click Here – Free 30-Minute Strategy Session
Be quick! FREE spots are almost gone for this Month
Since mobile devices are the epicenter of consumer behavior, they can now be used as a catalyst for marketing. Using mobile marketing analytics and trends, marketers can curate data for growth and increased consumer expectations.
Fact 1 – Mobile devices have some important features that other communication channels do not. These are immediacy, proximity, and intimacy. Being a personal medium means that marketers must understand the trends and personal habits of mobile users, to target their niche effectively.
Fact 2 – Marketers that create campaigns from mobile marketing and advertising trends will outperform others that don’t.
Fact 3 – According to Ericsson’s 2016 Mobile Report, mobile devices are paving the way for a more intricate ecosystem of connected devices – the Internet of Things (loT). These connections are expected to reach a 15 billion mark by 2021 making mobile digital marketing a vital business activity.
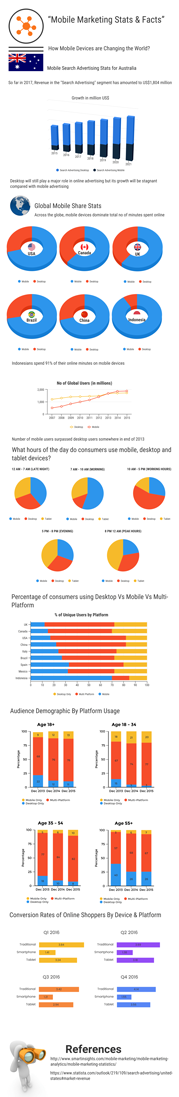
Fact 4 – Desktops are not outdated, but the new direction of digital marketing will be geared towards mobile device users because these are the consumers that spend more time online. Check out some of the below supporting figures:
• USA – Almost 75% are mobile users
• CANADA – Over 50% are mobile users
• UK – Over 50% are mobile users
• BRAZIL – Almost 75% are mobile users
• CHINA – Almost 76% are mobile users
• INDONESIA-About 91% are mobile users
It has become apparent that marketers cannot ignore consumers’ dependency on mobile devices. With this growth, marketers face increasing pressures to evolve at the same pace as mobile marketing.
Bench-marking and statistical analysis is now a major part of business management, especially in the area of marketing. The mobile marketing data gathered will help marketers develop an understanding of the people they serve. The information can help design and create campaigns, develop baseline results and business forecasts. It will also help marketers interpret trends and make business decisions that will drive growth.
Below are some critical questions that marketers must ask to drive effective campaigns. The facts and figures you’ll find here are mobile marketing trends for 2017, and reveal some consumer behavior that can be used in reshaping marketing decisions.
These days, people expect answers at their fingertips, and to get these answers, they turn to their mobile devices for quick facts. For marketers, this simply means that there are more avenues to engage with users than ever before. Below are recent figures that will help creating targeted engagement:
• 12 am -7 am: Late at night and during the early hours of the morning, users on mobiles, desktops, and tablets are spread out evenly.
• 7 am – 10 am: During the morning hours, there are more users on their mobile phones than on any other device.
• 10 am – 5 pm: The early morning trend changes as more users are on their desktops, followed by mobile devices.
• 5 pm – 8 pm: By evening, the tide changes with more users turning to their tablets.
• 8 pm – 12 am: The peak hours still have more users on their tablets, followed closely by the desktop.
Understanding when users are likely to be on their mobile devices will help marketers make efficient decisions about how and when to engage these users. Notice that Smartphone usage is higher at the times when many users are not at work, and that mobile and tablets are consistently used throughout the day and into the night.
We navigate back and forth between mobile phones, tablets, and computers all through the day. When most people are at home, they use mobile devices and tablets while concurrently using a computer. The percentage of consumers using desktops Vs mobiles Vs multi-platforms has increased exponentially in the last half-decade.
The growth can be attributed to the evolution of smart devices— ‘from mobility to connectivity’. This change means that people are more connected now than ever before. Interchanging device usage has changed our approach to marketing. Customers now connect with brands simultaneously on more than one device type, making it important that the same great experience is provided across devices.
To this end, your business intelligence for mobile marketing analytics should show geo-location statistics in numbers and percentages. This is especially important if your market niche is global. Below is some recent state:
• UK Mobile – Lower than 15% Desktop – More than 29% Multi platform – About 60%
• CANADA Mobile – Lower than 20% Desktop – About 30% Multi platform – About 50%
• US Mobile – Lower than 20% Desktop – Lower than 20% Multi platform – About 60%
• CHINA Mobile – More than 20% Desktop – Lower than 20% Multi platform – About 60%
• ITALY Mobile – Lower than 25% Desktop – More than 25% Multi platform – About 50%
• BRAZIL Mobile – More than 25% Desktop – Lower than 30% Multi platform – About 45%
• SPAIN Mobile – More than 30% Desktop – About 20% Multi platform – About 50%
• MEXICO Mobile – More than 30% Desktop – Lower than 30% Multi platform – About 40%
• INDONESIA Mobile – About 70% Desktop – About 15% Multi platform – About 15%
The demographics of our audience are also important data that marketers can harness for effective market planning. Research shows that
• Mobile use is higher for consumers aged Age 18-34.
• From the age of 35-54, users alternate between multi-platforms.
• From the age of 55, users favored desktops to mobiles.
Browsing the web is one of the main activities people perform every day, and even though mobile marketing statistics show that more users are on their mobile phones, it also reveals that desktop conversion rates are higher than mobile device conversion rates. With this unbalanced data, it’s important that marketers consider the mobile experience as a number one factor in increasing their mobile conversion rate. So the question that many marketers ask is why is the conversion rate higher on desktops than it is on mobile phones?
Many experts agree that site optimization is a key variable. However, mobile digital marketing, when done correctly, can help boost this conversion rate. To change your approach, you must take historical and real-time behavioral analysis into serious consideration.
So what do you think? Has your browsing habit changed drastically from desktop to mobile in last few years? Do you buy more products or services online via your Smartphone? Leave us a comment. We would love to know about your experience.
Be quick! FREE spots are almost gone for this Month


LEAVE A REPLY